

Between rooftops three miles apart, commercial surface temperatures can differ by 20°F or more. Facility teams have suspected this for years. They are now getting block-level data that proves it, and the insights are reshaping how portfolios think about cool roofs.
New heat-mapping platforms layer thermal exposure data over city maps at neighborhood and block granularity. Commercial properties sitting on a heat-dense block absorb significantly more radiant load than identical buildings a few miles away. When a large commercial portfolio spans multiple districts, the thermal penalty is no longer averaged away. It shows up on the map, and it shows up on the utility bill.
Urban Heat Is Not Evenly Distributed
A single city can contain a 15°F spread in near-surface air temperatures between its coolest and hottest blocks during a summer afternoon. Drivers include impervious surface cover, building density, tree canopy, and the reflectivity of nearby roofs. The result is a patchwork of thermal load that hits commercial assets unevenly.
Warehouses clustered near highway corridors often land on the hot side of that patchwork. Office towers near established tree canopy often land on the cool side. A portfolio that looks “roughly consistent” on a spreadsheet can look highly variable on a heat map.
For facility leaders, this is actionable. The highest-cost interventions belong on the hottest blocks. Lower-impact blocks can accept standard maintenance cycles. Capital planning gets sharper when heat data enters the picture alongside roof age, membrane condition, and HVAC load.
The Cool Roof Spec Is Evolving Past Reflection Alone
For two decades, the dominant metric for commercial cool roofs has been the Solar Reflectance Index (SRI). A higher SRI means the roof bounces more sunlight back into the sky on day one. SRI is useful, but it has a limitation. It measures the surface when it is clean and new.
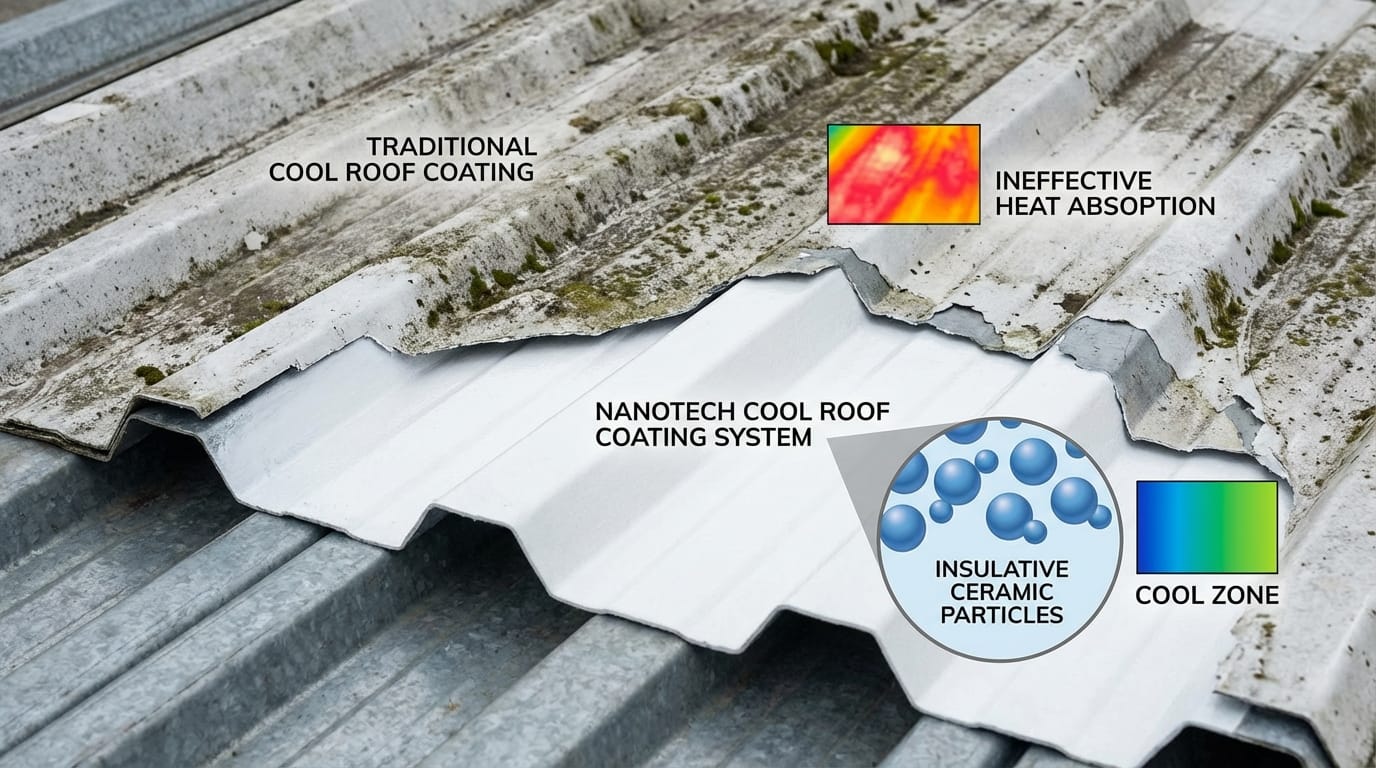
Commercial roofs do not stay clean. They collect dust, biological growth, and airborne particulate. Within a few years of installation, a coating with excellent initial reflectance can degrade to moderate reflectance, and the thermal performance drops with it. On a hot block, that degradation is the difference between a building that holds its HVAC savings and a building that quietly loses them.
This is where spec conversations are shifting. Facility teams are asking not only how much sunlight the roof reflects on day one, but how much heat it continues to reject as the surface weathers.
Heat Rejection vs. Heat Reflection: Why the Distinction Matters
Reflection sends visible and near-infrared light away from the roof surface. Rejection is a physical barrier to thermal transfer through the coating itself. A roof that rejects heat does not depend on a clean, bright surface to stop the conversion of radiation into interior load.
Insulative Ceramic Particle technology creates this barrier at the particle level. Engineered hollow ceramic structures scatter heat and block thermal transfer through the coating. Performance is not tied to surface cleanliness, which means the roof keeps working as it weathers through real-world conditions.
For facility managers, the implication is straightforward. A commercial roof on a hot-block property should be specified for rejection performance, not only reflection performance. The former holds up over time. The latter needs aggressive maintenance to keep delivering the wins it promised on the day of installation.
What to Look For When Specifying a Commercial Cool Roof
A few practical signals to raise with specifiers, consultants, and contractors. First, ask whether the coating’s thermal performance is characterized only by SRI, or whether independent data covers performance after weathering and soiling exposure. Second, ask about substrate compatibility. Coatings that bond directly to TPO, EPDM, metal, and spray foam without primer reduce installation cost and timeline.
Third, ask about certification coverage. Miami-Dade certification, ICC approval, and ISO-9001 manufacturing give facility teams the documentation they need for insurance, local code, and internal audit.
Solutions like Cool Roof Coat are built around Insulative Ceramic Particle technology, bond directly to major commercial substrates, and deliver 3x HVAC load reduction versus the nearest competitor. For blocks that show up hot on the heat map, that combination is difficult to ignore.
Turning Heat Data Into Portfolio Decisions
Block-level heat maps are changing how facility portfolios prioritize roof capital. A few patterns keep showing up. Properties on the hottest blocks show the shortest payback periods when re-coated with a high-rejection system. Properties in historic cores with restricted replacement windows benefit most from restoration coatings that avoid tear-off. Industrial clusters in warehouse districts often show the widest gap between current HVAC load and achievable load after a roof upgrade.
Facility leaders running multi-site portfolios can now layer heat data, roof age, membrane condition, and energy spend to sequence capital over a two to three year window. The buildings that need the biggest intervention are no longer a guess. The map shows them, and the coating choice matters more on those assets than anywhere else in the portfolio.
Urban heat is getting more visible. Commercial cool roofs have a real role to play. The specification question is no longer whether a cool roof is worth it. It is which cool roof will still be working when the surface is dirty and the summer is long.
Share this article
Ready to Transform Your Building's Performance?
Learn how NanoTech Materials' advanced coating solutions can help you achieve your energy efficiency and sustainability goals.
Get Started